Trading without tools is like sailing blind—indicators light the way. The most common trading indicators help traders in 2025 decode price moves, spot trends, and time entries across online markets. They’re the compass for stocks, forex, and crypto.
Why Indicators Matter
Indicators crunch chaos into clarity. The most common trading indicators turn raw data—price, volume—into signals. In 2024, a forex trader caught USD/JPY’s climb with RSI—overbought, sold, won.
They’re not magic. A stock might buck a signal—X hype in 2025 could defy charts. But they tilt odds, guiding when to jump or bail.
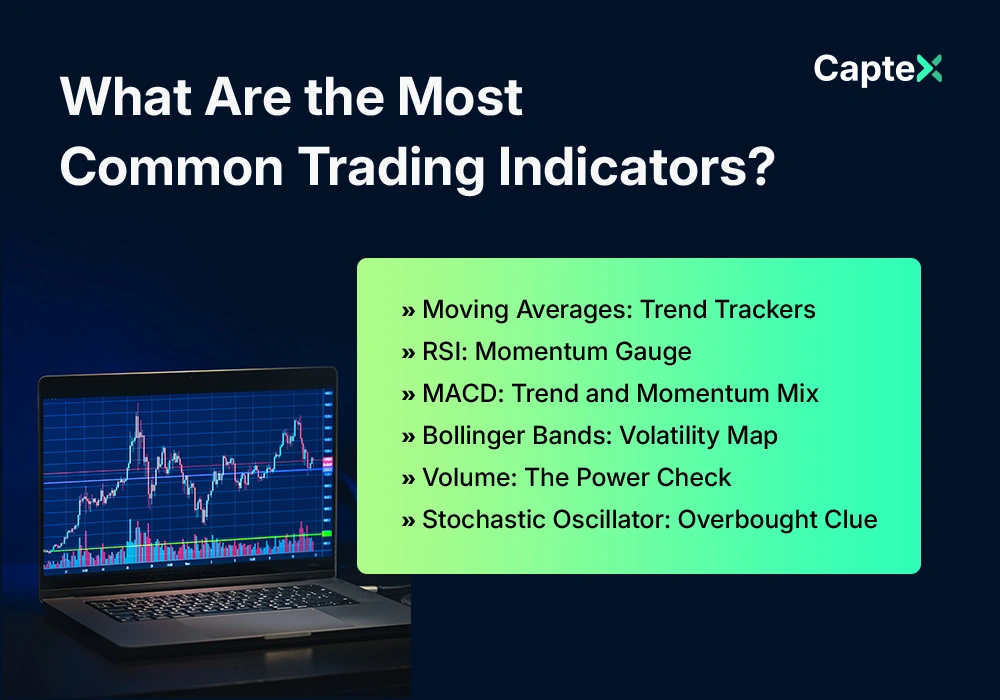
Moving Averages: Trend Trackers
Moving averages smooth price noise. Simple (SMA) or exponential (EMA)—50-day, 200-day—they show direction. A 2023 “golden cross” on Tesla—50 over 200—sparked buys, up 20%.
Crossovers signal. EMA’s faster—crypto traders in 2025 might catch Bitcoin’s dip at $50,000 with a 20-day drop. Easy, effective.
RSI: Momentum Gauge
Relative Strength Index (RSI) measures speed—0 to 100. Above 70? Overbought—sell. Below 30? Oversold—buy. In 2024, a forex trader nabbed EUR/USD at 25—rebound netted 50 pips.
Watch divergence. Price climbs, RSI falls—reversal looms. The most common trading indicators shine here—RSI’s a crowd fave.
MACD: Trend and Momentum Mix
MACD—Moving Average Convergence Divergence—pairs lines. Line crosses signal—above zero, bullish; below, bearish. A 2023 stock trader sold Apple on a bearish cross—down 10%, cashed out.
Histogram adds depth—widening bars mean momentum. In 2025, a crypto scalper might time Ethereum’s $2,000 break with it. Versatile, sharp.
Bollinger Bands: Volatility Map
Bollinger Bands frame price—middle SMA, two bands at standard deviations. Tight? Calm. Wide? Wild. A 2024 oil squeeze—bands pinched—broke $80, traders rode it.
Breaks signal. Price hugs the top—uptrend. Bottom—down. The most common trading indicators like this catch big swings.
Volume: The Power Check
Volume’s raw—bars under price. Spike with a jump—like Tesla’s 2025 X-driven 5% pop—means real. Low volume on a crypto rise in 2023? Fakeout, crashed.
Pair it up. A forex trader in 2024 skipped a GBP/USD move—low bars, no juice. Volume confirms or kills.

Stochastic Oscillator: Overbought Clue
Stochastic compares closes to ranges—0 to 100. Above 80? Sell. Below 20? Buy. A 2025 stock trader might grab Nvidia at 15—up 8% in days.
Crosses count. Fast line over slow—momentum shifts. It’s RSI’s cousin, snappy for quick plays.
How to Use Them
Don’t overload. Two or three max—MACD and volume, say. In 2023, a cluttered crypto chart missed Bitcoin’s $40,000 turn. The most common trading indicators work clean.
Limits and Wins
They’re not foolproof. A 2024 stock ignored Bollinger—news trumped. But wins stack—RSI caught gold’s $1,900 dip in 2023, up $100 fast. Practice makes them yours.