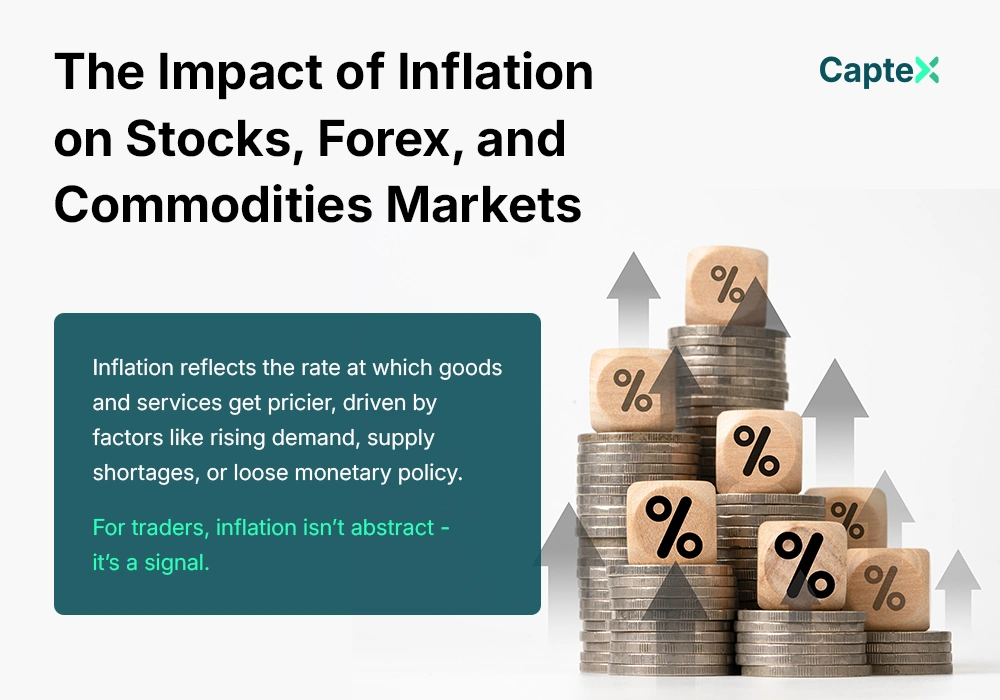
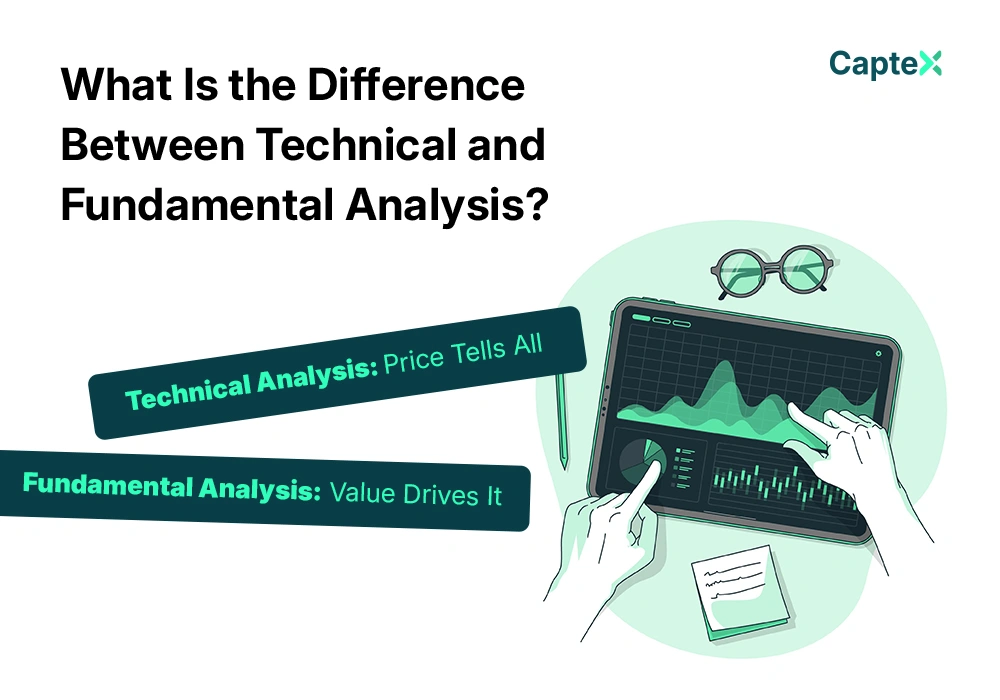
Trading leans on two big lenses—technical and fundamental analysis. The difference between technical and fundamental analysis shapes how you tackle 2025’s online markets, from quick scalps to long holds. One’s about charts; the other’s about value.
Platforms like TradingView or Yahoo Finance serve both—candlesticks for techies, earnings for fundies. Each has its crowd, its edge, and its blind spots. Let’s break down what sets them apart.
Defining the Two Approaches
The difference between technical and fundamental analysis starts with focus. Technical analysis reads price action—charts, patterns, indicators. A forex trader in 2024 spotted USD/JPY’s breakout at 150—pure chart play.
Fundamental analysis digs deeper—company health, economic data, news. An investor in 2023 bought Tesla on strong EV sales, not squiggles. One’s short-term; one’s big-picture.
Technical Analysis: Price Tells All
Tech analysis bets prices hold the truth. Candlesticks, RSI, moving averages—tools map trends. In 2025, a crypto trader might catch Bitcoin’s $60,000 resistance—sell, bank it.
It’s fast. A stock’s double bottom in 2024 screamed buy—up 10% in days. History repeats—support, resistance, breakouts guide. No earnings needed; the chart’s king.
Fundamental Analysis: Value Drives It
Fundamentals seek worth. Revenue, profits, debt—numbers matter. A 2023 Apple investor saw $383 billion in sales—held for years, up 50%. It’s why Buffett skips charts.
Macro counts too. A forex trader in 2024 shorted EUR/USD on weak EU GDP—fundamentals signaled the drop. It’s slow, deep, and less twitchy.
Timeframe Split
Time’s a divider. Technical analysis thrives short—minutes to weeks. A 2025 scalper might grab 20 pips on GBP/USD in an hour—chart-driven, done. Day traders love it.
Fundamentals stretch long—months to decades. A stock pick in 2022 on Amazon’s cloud growth paid off by 2025—patient cash. Investors lean here.
Tools and Data
Tech’s toolkit is visual. TradingView’s Bollinger Bands flagged a 2023 oil squeeze—traders jumped. Patterns—head and shoulders, triangles—predict. It’s price and volume, no fluff.
Fundamentals need reports—10-Ks, GDP stats, Fed speeches. A 2025 X post on rate cuts might lift stocks—fundies read the why. It’s numbers and news.
Risk and Mindset
Tech’s risky, quick. A 2024 crypto fakeout at $50,000 burned chasers—charts misfire. It’s reactive—miss a signal, lose fast. Traders thrive on gut and speed.
Fundamentals feel safer, slower. A 2023 bond buy on Fed hikes held steady—data-backed. Risk’s in misreading value—overpay, wait years. Patience rules.
Real-World Wins
Tech shines short. A forex trader in 2025 might ride USD/CAD’s 50-day average cross—50 pips in a day. In 2021, GameStop’s chart surge netted millions for scalpers.
Fundamentals build long. A 2020 Nvidia buy on AI growth hit 300% by 2025—sales, not lines. The difference between technical and fundamental analysis plays out in profits.
Which Fits You?
Your game picks it. Love charts and quick hits? Technical’s your lane—scalp X-driven crypto in 2025. Prefer value and chill? Fundamentals fit—buy a stock on earnings, hold.